
In the fast-paced world of financial markets, making informed and timely trading decisions is crucial. Technical analysis plays a vital role in helping traders evaluate potential price movements by studying past market data, primarily focusing on price fluctuations and trading volumes. Through chart patterns, technical indicators, and other analytical tools, traders can time their entries and exits more effectively. This structured framework not only enhances the ability to predict market trends but also provides a competitive edge in volatile markets.
In this comprehensive blog, we will explore how chart patterns, key technical indicators such as moving averages and the Relative Strength Index (RSI), and trend analysis empower traders to make better-informed trading decisions.
1. The Role of Chart Patterns in Trading
Understanding the Power of Chart Patterns
Chart patterns are a critical element of technical analysis, offering visual representations of market psychology and investor sentiment. By recognizing these patterns, traders can anticipate potential trend reversals or continuations, providing valuable insights into the future direction of the market. Some common chart patterns include:
- Head and Shoulders: A reversal pattern that signals the end of an existing trend.
- Double Tops and Bottoms: Indicating reversals in market direction.

Double Bottom pattern indicating upward price reversal - Triangles: Often suggest continuation patterns, where price moves within converging trendlines.

Recognizing these chart patterns helps traders predict future price movements with higher confidence. For example, a Head and Shoulders pattern marks the end of an uptrend, while a Double Bottom pattern signals the potential start of an upward price movement.
2. How to Identify and Use Chart Patterns
The process of using chart patterns involves carefully observing price movements and trendlines. When a pattern like Head and Shoulders is identified, traders often wait for confirmation by observing the break of the neckline before entering a trade. Combining chart patterns with additional indicators, such as moving averages, can further enhance the accuracy of predictions and improve trading outcomes.
3. Key Technical Indicators for Trading Decisions
Moving Averages: A Simple Yet Powerful Indicator
Moving averages (MAs) are among the most widely used indicators in technical analysis. They provide a smoothed representation of historical price data and help traders identify trends, confirming market direction.
- Simple Moving Average (SMA): The average of a set of prices over a specific period, such as a 50-day or 200-day SMA. Traders use the SMA to identify trend changes and key support or resistance levels.

Moving Averages crossover signaling buy/sell opportunities - Exponential Moving Average (EMA): The EMA gives more weight to recent price data, making it more responsive to price movements. Traders often use the 9-day, 50-day, and 200-day EMAs to spot potential entry and exit points.

A bullish crossover occurs when a short-term moving average crosses above a long-term moving average, signaling a potential buying opportunity. On the other hand, a bearish crossover happens when a short-term moving average crosses below a long-term moving average, suggesting a potential selling opportunity.
4. Relative Strength Index (RSI): Measuring Overbought and Oversold Conditions

The Relative Strength Index (RSI) is a widely used oscillator that helps traders assess whether a market is overbought or oversold. The RSI ranges from 0 to 100, with readings above 70 indicating an overbought condition and readings below 30 signaling an oversold market.
- Overbought conditions often suggest a potential price reversal to the downside.
- Oversold conditions generally indicate that a price reversal to the upside is likely.
When combined with other technical indicators like moving averages, the RSI can confirm trade setups and reduce the likelihood of false signals.
5. Trend Analysis: The Backbone of Technical Trading

Understanding Market Trends
At the core of technical analysis lies the concept of market trends. A trend represents the general direction in which the market or an asset’s price is moving. There are three primary types of trends:
- Uptrend: Characterized by higher highs and higher lows.
- Downtrend: Defined by lower highs and lower lows.
- Sideways/Consolidation: Price moves within a horizontal range.
Traders use trendlines to visually represent market trends and assess potential price movements. In an uptrend, the market consistently forms higher highs and higher lows, whereas in a downtrend, it creates lower highs and lower lows.
6. Using Trendlines and Channels for Entry and Exit Points
Trendlines are drawn by connecting the peaks or troughs of price movements, indicating the direction of price action. By creating trend channels, which are parallel lines drawn above and below the trendline, traders can identify the potential price range. These tools help traders pinpoint support and resistance levels, which serve as key entry and exit points.
- When the price reaches the lower trendline in an uptrend, it may signal a buying opportunity.
- Conversely, when the price reaches the upper trendline in a downtrend, it could be a good time to sell.
7. Combining Technical Indicators for Better Trade Decisions

Why Combine Indicators?
No single technical indicator can guarantee a successful trade. To increase the reliability of trade signals, many traders combine multiple indicators. This multi-indicator approach reduces the risk of false signals and improves the probability of making profitable trades.
For example, a trader may use the Moving Average Convergence Divergence (MACD), which shows the relationship between two EMAs, alongside the RSI. When both indicators align, it provides confirmation that the market is overbought or oversold, making the trade decision more reliable.
8. The Importance of Risk Management in Technical Analysis
Managing Risk for Consistent Profits
While technical analysis can help traders make more informed decisions, it cannot predict market movements with complete certainty. Therefore, risk management is a critical aspect of long-term trading success. Traders use various tools to minimize potential losses and secure profits, such as:
- Stop-Loss Orders: These are set at predetermined price levels to limit potential losses if the market moves against the trader’s position.
- Take-Profit Levels: Pre-set price points at which traders close their positions to lock in profits.
By incorporating risk management tools into their strategy, traders can ensure that a few bad trades do not wipe out their overall profits.
9. Psychological Factors in Technical Analysis
Mastering Trading Psychology
Successful traders know that emotions play a significant role in their decision-making. Fear and greed often lead to impulsive decisions, such as exiting trades too early or holding on for too long. To counter this, traders must develop a disciplined mindset, sticking to their technical analysis strategy and managing emotional reactions. Mental fortitude is just as important as any technical tool in achieving long-term success in the markets.
10. Backtesting Strategies to Improve Trade Accuracy
Evaluating Past Performance
Backtesting is a powerful technique used by traders to evaluate the effectiveness of a trading strategy. By applying a strategy to historical data, traders can assess its potential profitability and fine-tune their approach before committing to real trades. Backtesting helps traders build confidence in their methods and avoid making decisions based on market noise.
11. Candlestick Patterns: Decoding Market Sentiment
Understanding Candlestick Patterns
Candlestick patterns are one of the most powerful tools in technical analysis. Each candlestick provides a snapshot of market sentiment and can indicate potential trend reversals or continuations. Some popular candlestick patterns include:
- Doji: A pattern that signifies indecision in the market.
- Engulfing Pattern: A bullish or bearish reversal pattern.
- Hammer: Often signals a potential reversal after a downtrend.
By learning how to read and interpret candlestick patterns, traders can gain valuable insights into market sentiment, helping them make better trading decisions.
12. Bollinger Bands: Understanding Market Volatility
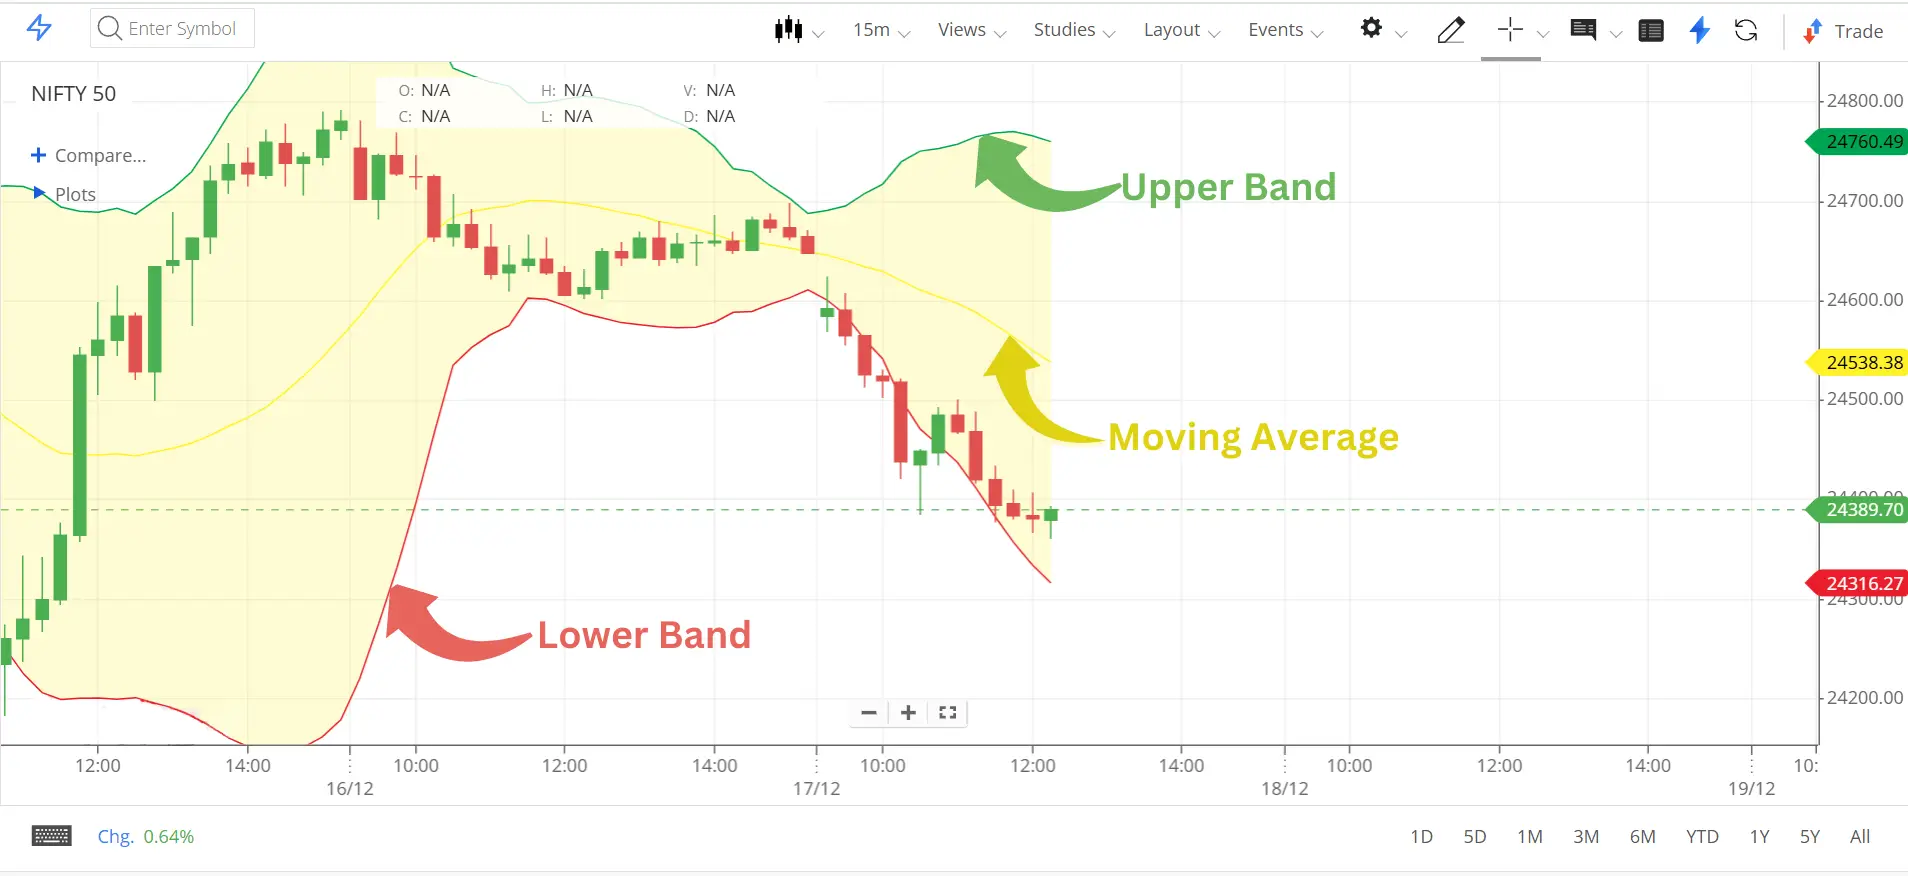
Using Bollinger Bands for Volatility Analysis
Bollinger Bands consist of a moving average with two standard deviation lines above and below it, forming an upper and lower band. These bands help traders assess market volatility and identify overbought or oversold conditions. When the price reaches the upper band, it may signal that the market is overbought, while prices reaching the lower band may indicate an oversold market.
By understanding how to use Bollinger Bands in conjunction with other indicators, traders can gain insights into market behavior and adjust their trading strategies accordingly.
13. Fibonacci Retracements: Predicting Key Price Levels
Utilizing Fibonacci Levels in Trading
Fibonacci retracements are another popular tool in technical analysis, used to identify potential reversal levels in the market. These levels are derived from the Fibonacci sequence, and traders use them to pinpoint key price levels where markets might reverse or consolidate. The most commonly watched Fibonacci levels are 23.6%, 38.2%, 50%, 61.8%, and 100%.
By incorporating Fibonacci retracements into their strategy, traders can identify areas of support and resistance, allowing them to make more informed decisions regarding entry and exit points.
14. Volume Analysis: Understanding Market Strength
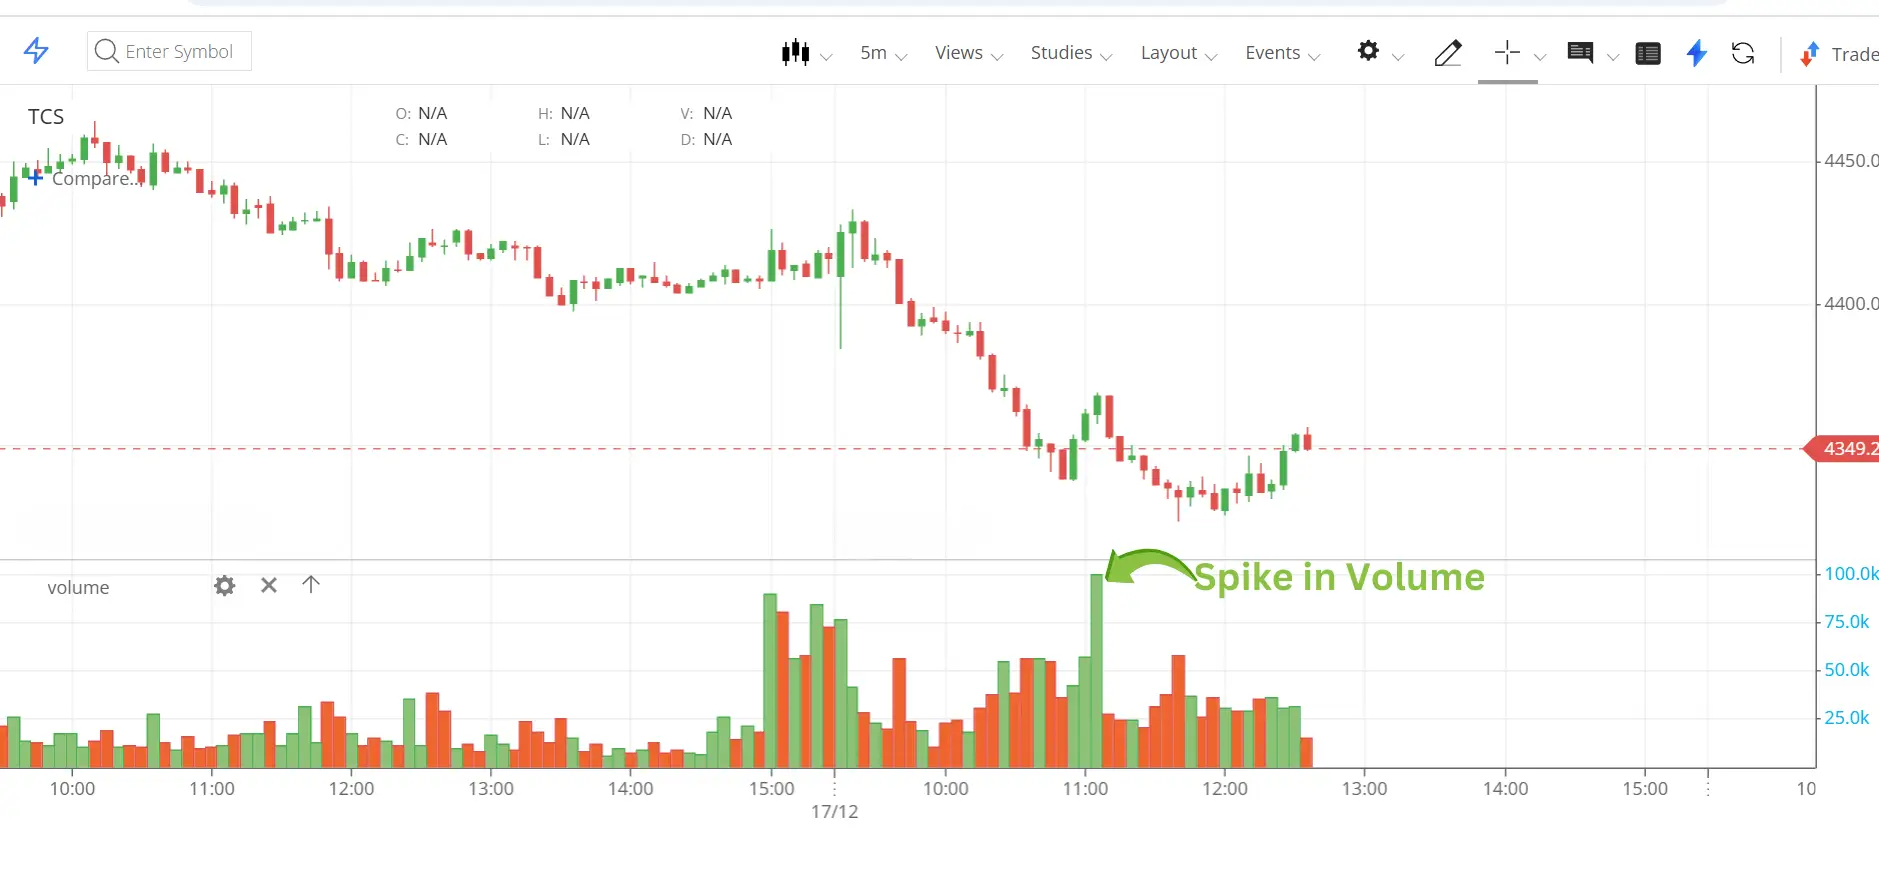
Using Volume to Confirm Price Movements
Volume is an essential factor in technical analysis, as it confirms the strength of price movements. When a price movement is accompanied by high trading volume, it suggests that the move is supported by significant market interest, making it more likely to continue. On the other hand, price movements with low volume may indicate a lack of conviction and could be more prone to reversal.
Traders use volume analysis to validate signals from other technical indicators and chart patterns, improving the reliability of their trade decisions.
Conclusion: Mastering Technical Analysis for Trading Success
Technical analysis equips traders with essential tools to navigate the financial markets effectively. By mastering key components such as chart patterns, technical indicators, trend analysis, and advanced tools like candlestick patterns, Bollinger Bands, Fibonacci retracements, and volume analysis, traders can anticipate market movements and make well-informed trading decisions.
When combined with robust risk management strategies, these tools enhance trading success while minimizing potential losses.
Whether you are a beginner looking to learn the basics or an experienced trader seeking to refine your skills, technical analysis remains a cornerstone of any successful trading strategy. By integrating these techniques, you can improve decision-making, identify trading opportunities, and achieve consistent results in the market.
For additional insights and strategies, check out our Top 5 Stock Market Tips for 2025.
For live Nifty 50 charts and data insights, visit NSE India: Nifty 50 Live Chart & Analysis.